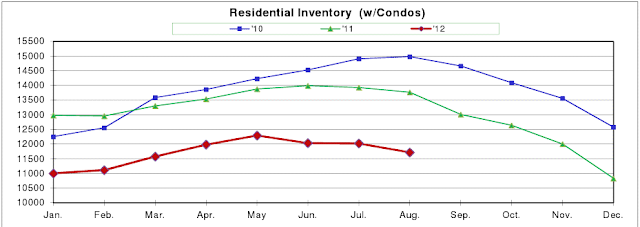
Let's start with a chart, shall we? I keep hearing about prices in the area improving - why would that happen?
If we think about the laws of "Supply and Demand" we see that our supply of residential inventory is quite low and has been ALL year long. Considerably low. In fact, if we follow the same trends as the previous two years....we may not have any inventory at all! (That's not likely to happen). What this does indicate is that prices will hold steady, and more sellers will be encouraged to step into the market. This also indicates to me, that if you are a seller right now who is not on the market but wants to be...GET THERE! Get your house looking perfect - price it right with a professional and you could spend much less time on the market. A telling figure; August Days on Market are down comparatively nearly 15%. Average Continuous Days on Market is sitting at about 154 for August. Many areas will experience much less.
Need more proof that low inventory helps housing prices? Take a peek below:
My guess is that when I post this again in October that our September numbers are going to be in the positive from the previous two years. One thing is for certain - 2012 housing prices in the Cincinnati Area have stabilized this year.
Another promising sign:
The blue line in 2012 is when the first time home buyer tax credit went away, so buying slowed considerably after June. This chart shows we're back on the right track moving more inventory. A fact that should encourage home sellers, because as I showed up top - this is with not much inventory compared to the two previous years. Think about that...Low inventory, but Selling more Units than previous years. This could be a very good Fall indeed!
As always if you would like to see how your home compares to the charts above - where it fits in, give me a shout. Or, go here: www.chrisjwood.com and fill out the form.
Chris W.


No comments:
Post a Comment